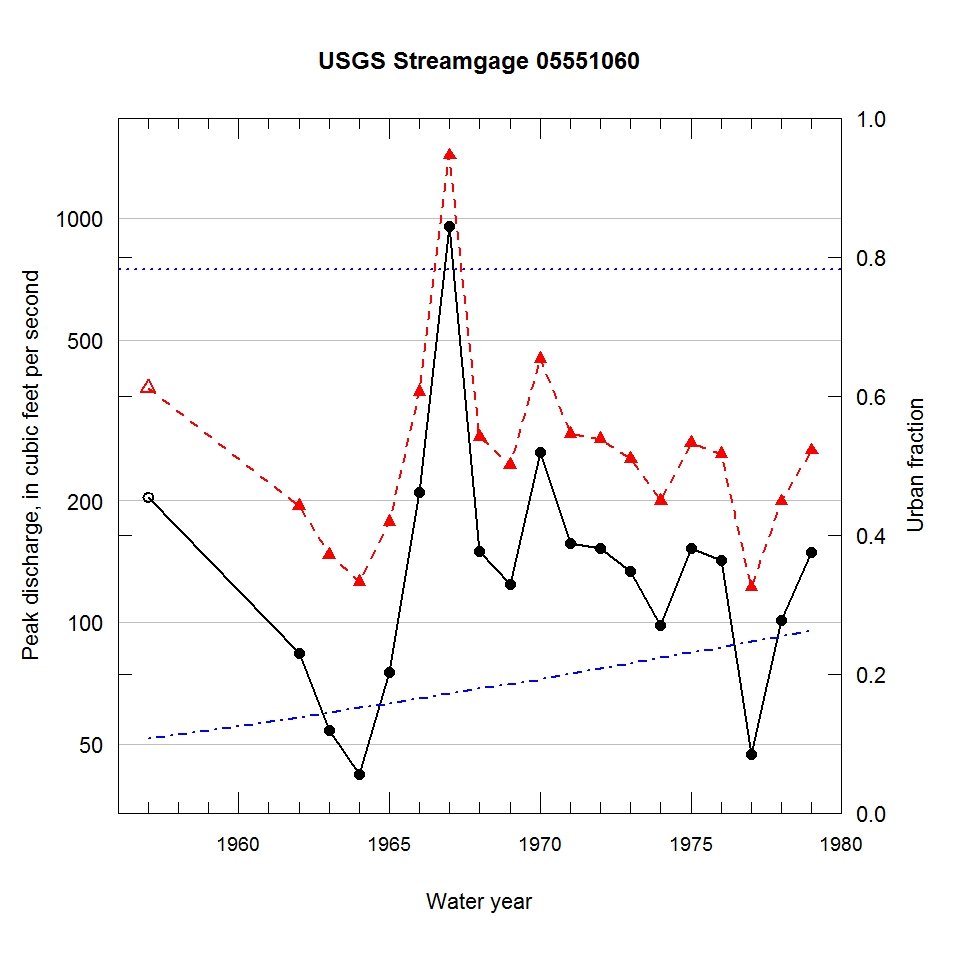
Observed and urbanization-adjusted annual maximum peak discharge and associated urban fraction and precipitation values at USGS streamgage:
05551060 NORTON CREEK NEAR ST. CHARLES, IL


| Water year | Segment | Discharge code | Cumulative reservoir storage (acre-feet) | Urban fraction | Precipitation (inches) | Observed peak discharge (ft3/s) | Adjusted peak discharge (ft3/s) | Exceedance probability |
| 1957 | 1 | 7 | 0 | 0.108 | 2.267 | 204 | 380 | 0.174 |
| 1962 | 1 | -- | 0 | 0.138 | 0.289 | 84 | 194 | 0.756 |
| 1963 | 1 | -- | 0 | 0.145 | 1.223 | 54 | 147 | 0.901 |
| 1964 | 1 | -- | 0 | 0.151 | 0.683 | 42 | 126 | 0.940 |
| 1965 | 1 | -- | 0 | 0.158 | 0.134 | 75 | 177 | 0.812 |
| 1966 | 1 | -- | 0 | 0.165 | 1.366 | 210 | 372 | 0.185 |
| 1967 | 1 | -- | 0 | 0.172 | 1.167 | 954 | 1430 | 0.000 |
| 1968 | 1 | -- | 0 | 0.179 | 1.487 | 150 | 288 | 0.406 |
| 1969 | 1 | -- | 0 | 0.186 | 1.274 | 124 | 245 | 0.556 |
| 1970 | 1 | -- | 0 | 0.193 | 1.417 | 264 | 449 | 0.100 |
| 1971 | 1 | -- | 0 | 0.200 | 0.357 | 157 | 293 | 0.390 |
| 1972 | 1 | -- | 0 | 0.208 | 0.562 | 152 | 284 | 0.420 |
| 1973 | 1 | -- | 0 | 0.216 | 1.372 | 134 | 254 | 0.522 |
| 1974 | 1 | -- | 0 | 0.223 | 1.197 | 98 | 200 | 0.734 |
| 1975 | 1 | -- | 0 | 0.231 | 0.036 | 152 | 278 | 0.439 |
| 1976 | 1 | -- | 0 | 0.239 | 1.099 | 142 | 261 | 0.497 |
| 1977 | 1 | -- | 0 | 0.247 | 0.633 | 47 | 122 | 0.947 |
| 1978 | 1 | -- | 0 | 0.254 | 1.357 | 101 | 199 | 0.739 |
| 1979 | 1 | -- | 0 | 0.262 | 0.712 | 149 | 266 | 0.480 |

